Table of Contents
This is a simple overview of the basics of sound, human hearing and the workings
of digital audio recording, with particular focus on the recording of bird songs
and calls. There will be almost no mathematics, but enough of the important
concepts, so you will know a little bit about what to consider when buying a
recorder and also so you will understand the important recording parameters that
you can control and how to set them.
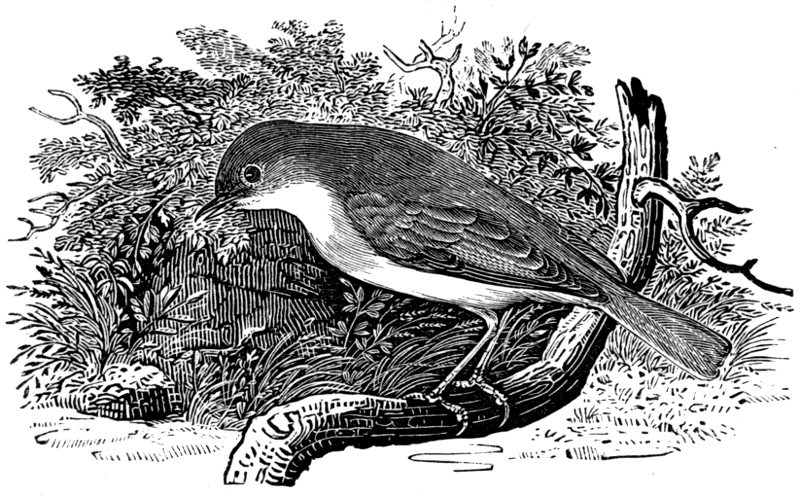 Garden warbler, Sylvia Borin (Trädgårdssångare). Engraving by Thomas Bewick from J.E. Harting's Our Summer Migrants - An Account of the Migrants Birds which pass the Summer in the British Islands (May 21, 1919). This picture is here just because it's more fun to read articles with pictures and because I like Bewick's illustrations. And also because there is a recording of a Garden warbler in this article.
Sound, hearing and bird vocalisations
Sound is a vibration that propagates in the form of rapid changes in pressure
in air, or some other medium like water, that reach our ears. Changes in
pressure are caused by some rapid mechanical event or vibration, such as a
hand clap, the vibration of human vocal cords or the tympaniformis membranes in
the syrinx of a bird. The rapid changes in pressure propagate through the air
and reach our ears where they are turned into nerve signals that our brain
interprets, and which then results in our perception of sound. The number of
vibrations or wave cycles per second is called the frequency of the sound and is
measured in Hertz (cycles per second).
The physical properties and limitations of our ears, nerves and brain, determine
the hearing range of frequencies that we can percieve. The range is usually given
as 20 to 20.000 Hz, though there is considerable variation in range between
individuals. Human hearing abilitiy is not linear with respect to frequencies.
We are more sensitive to differences between low frequencies than higher
frequencies. The Mel scale describes
this human perception of frequencies. In practice it means that we can easily
hear the difference bettween the note A4 at 440 Hz and B4 note at 493.88 Hz, but
have much more difficulty in hearing the difference between 10,440 Hz and
10,493.88 Hz. It should also be noted that our sensitivity to the strength of
sounds, loud and weak sounds, varies with frequency.
Most bird vocalisations have frequency ranges between 1 kHz and 8 kHz. The
hearing range of birds is usually said to be 50 Hz - 12 Hz, which would indicate
that their vocalisation range should be in the same range. However some birds
can utter sounds as low as 20 kHz or as high as 16 Khz. The Ecuadorian hillstar,
Oreotrochilus chimborazo, (Ecuadorbergstjärna),
a hummingbird has been recorded vocalising at 13.3–16.4 kHz, with harmonics
ranging up to almost 28 kHz.
But that is very exceptional.
Fortunately for us, most birds vocalise in frequency ranges well in the hearing
range of humans, though some of us, with age, loose the the capacity to hear the
higher pitched calls of some birds. With age, our upper frequency limit comes
down to 12 kHz or even as low as 8 kHz, which means that some high pitched bird
songs and calls can be difficult or impossible to hear.
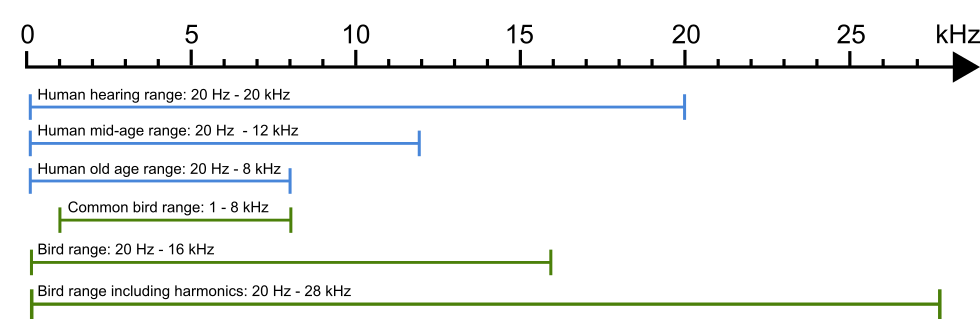 The frequency ranges of human hearing and bird vocalisation.
The frequencies that can actually be heard by humans, is of course an important
aspect of recording audio. Most audio recording equipment is designed in such
a way as to optimize the recording quality and fidelity for human ears.
A song phrase of a Garden Warbler, Sylvia borin (Trädgårdssångare).
Recorded by Paul Cohen, 13 June 2020, near Nackamasterna, Stockholm, Sweden.
Recorded with a Sony PCM A10 recorder.
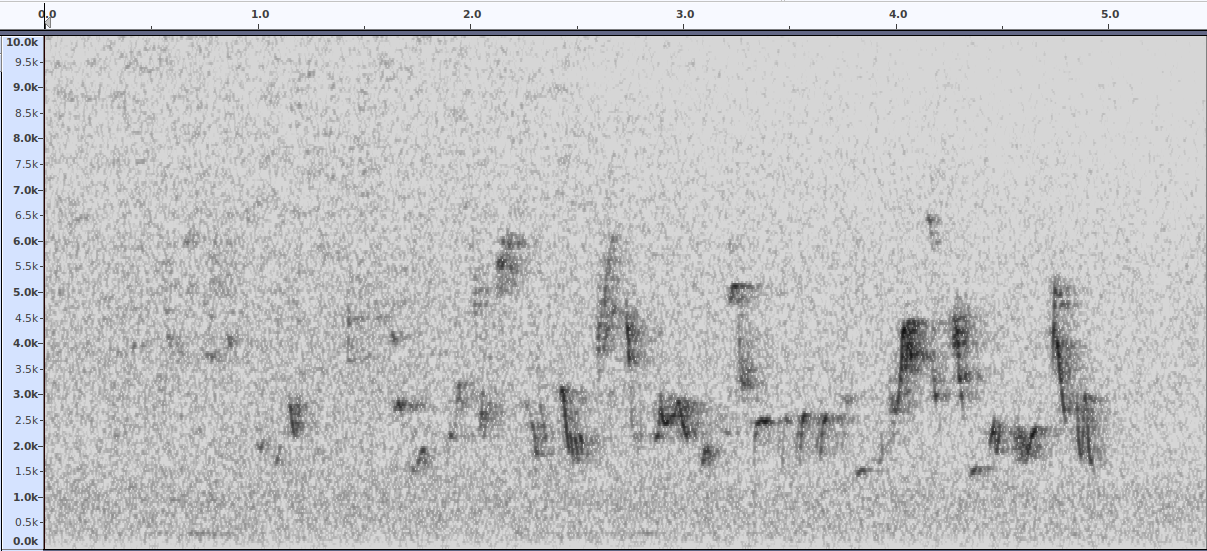 Sonogram of the recording above. The frequency range of the singing bird
in this recording is 1,5 kHz to 6,5 kHz.
Sonogram of the recording above. The frequency range of the singing bird
in this recording is 1,5 kHz to 6,5 kHz.
Audio challenges in a noisy world
We are seldome in a situation of complete silence, there are always different
sounds coming from different sources. It can be natural sounds, like waves, the
wind and rustling leaves, or man made sounds, like cars, airplanes and other
noisy birders. And of course, it can also be other animals and birds. This is
a challenge when trying to listen to, or record, a particular song or call.
There are special types of microphones that can be used to focus the recording
of sound from a specific direction, such as shotgun microphones and parabolic
microphones. However, in this article I will only discuss the general aspects of
digital sound recording. With digital audio recordings, we can to some degree,
“clean” up the song or call of interest, and remove some of the noise and
undesired sounds in a sound recording.
From mechanical wave to electrical signal
A microphone turns the mechanical wave of sound into an electrical signal. There
are different types of microphones but the general principle in all microphones
is the same; some electro-mechanical device converts the sound waves into
an electrical signal with the same form as the original sound wave. There are
two main types of microphones today; dynamic and condensor microphones. All
cameras, mobile phones and hand-held sound recorders use condensor microphones,
and most microphones for field use are also condensor microphones.
The signal strength of the electrical signal generated in a microphone is very
weak. Before any subsequent manipulation of the signal is done it is always
amplified with a preamplifier.
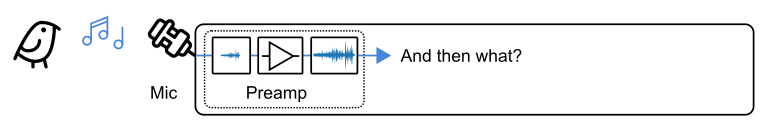 The preamp of a digital recorder.
Preamplifiers are a technological niche of their own. Their main purpose is
to amplify the weak electrical microphone signal in the cleanest way possible,
without amplifying noise and electrical humming, to an electrical signal
strength that is suitable for subsequent signal manipulation. If you are cool,
you call them preamps. In cheaper microphone and audio interfaces you will have
some simpler cheaper preamp built in. If you are a professional audio engineer
you will most surely have a separate dedicated stand-alone preamp which can
easily cost more than 2,000 USD (20.000 SEK). Obviously, that is for studio
audio engineers and not something a birder would be carrying around in the
field, though I assume that professional wildlife film teams and some scientists
do carry along equipment like that.
Both the microphone and the preamp will generate noise themselves. The better
quality microphones and preamps of course will generate less noise. In cameras
and mobile phones you have quite cheap and basic condensor microphones as well
as quite cheap and basic preamps. In hand held audio recorders, however there
is quite some difference in the quality of both microphones and in preamps,
between different brands and models. So that is definitely something to consider
when deciding on buying a hand held audio recorder for recording birds in the
field. The general rule of thumb is, as usual, the better equipment, the more
you have to pay.
In all recorders you will be able to control the recording level of the
preamp. The basic principle is that you want to have as loud a signal as
possible without hitting the ceiling of the recording device. When controlling
the recording level, we always consider the ceiling to be at 0 dB. Allowing the
normal level of the recording to reach, at the most, between -6 dB and -12 dB is
a good rule of thumb. That provides space for occasional and even louder peaks
to not spoil the recording. But given a good recording setting you can go up to
-3 dB.
From electrical signal to digital representation
We now want to convert our electrical analog signal to a digital signal. This is
desirable for a number of reasons. We can store it and easily manipulate it on
computers and other digital devices and we can do so without loss of digital
information. At any later point, we can reverse the process and generate an
electrical analog signal which then can be sent to a loudspeaker, so we can
listen to the audio again.
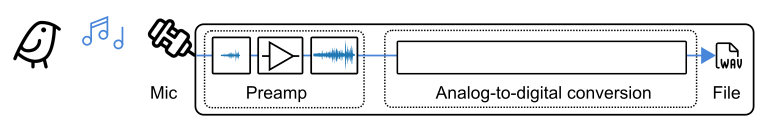 The analog to digital conversion process resulting in a digital audio file.
The conversion of an electrical analog signal to an electrical digital signal is
a clever and tricky process. The general name for this is simply called analog
to digital conversion, or AD-conversion. The most clever part of this, is the
sampling and encoding process, which is described further down.
The end result of an AD-conversion is a sequence of digital values representing
the audio signal and which can be saved to a file with a suitable audio file
format. Recording devices usually store recorded digital audio to an uncompressed
digital audio file format, such as WAV or AIFF, but mobile phones typically save
to MP3, which is a compressed and lossy format. If you wish to do digital audio
manpiulation with your recordings you should always do it with the uncompressed
audio file formats. They can be compared to the RAW image formats that better
digital cameras support.
The AD-conversion process
The central part of AD-conversion is the sampling and encoding process. I will
describe the most common sampling and encoding process used, which is called
Linear Pulse Code Modulation (LPCM), and which, to my knowledge, is used in all
consumer recording equipment. But first a few words on what is meant by an
analog signal and a digital representation of a signal. If you are just interested
in the direct consequences for buying and useing a recorder, you can skip to the
last section.
Sampling
An electrical analog audio signal is a continous signal where the amplitude
varies continuously with the pressure of sound waves. We can theoretically
measure the voltage at any arbitrary moment in time and the measured voltage can
have an infinite number of values, only constrained by the range and sensitivity
of our measuring equipment.
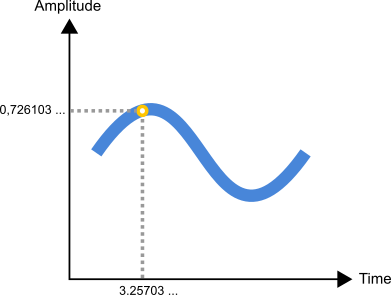 An analog signal measured at an arbitrary point in time.
Conversion of this analog signal into a digital signal is done in three steps.
First the we decide to only measure the amplitude at fixed and equidistant
discrete points in time. This is called sampling and the time distance between
the measuring points is specified by the sampling frequency. A sampling frequency
\(f_s\) of 44.1 kHz means we measure a sample every \(\frac{1}{44.100}\) ms =
0.022675 ms.
Quantizing and encoding
After sampling we want to capture the amplitude of the sampled signal and
digitally encode it.
All digital representations of information are mathematically discrete. By
discrete is meant that there is only a finite set of distinct and non-continous
values that can be represetented. The total number of values that can be
represented is decided by the number of bits we choose to use. There exist
digital representations that use variable bit length numbers, but for our
purpose we will only consider fixed bit length representations.
With 2 bits we can represent two values, with 3 bits we can represent 8 values
and with 4 bits we can represent 16 values, etc. The general formula for the
number of values that can be represented with N bits is 2\(^{N}\). So with
16 bits we can represent 2\(^{16}\) values, which is 65,536 values, and with
24 bits we can represent 2\(^{24}\) values, which is 16,777,216 values.
Given a signal strength that varies between 0,0 and 1,0 volts and 24 bits to
represent the signal strength, we can represent 16,777,216 values between 0,0
and 1,0 volts. If we chose to have equidistant values
Actually, having equidistant values is what is meant
by linear in Linear Pulse Code Modulation. PCM is the more general term,
referring to the general technique described here, of sampling and quantizing
an analog signal.
, it would mean the step between each represented value would be
\(\frac{1}{16,777,216}\) v = 0.00006 mV.
After having decided how many values to split the amplitude range in, we take
the sequence of sampled values, one every 0,022675 ms, and round it off to the
nearest amplitude value (in our set of equidistant amplitude values). This is
called quantizing. Note that we here introduce a rounding error that,
though small, still changes the recorded amplitude values. We call this a
quantizing error or quantization noise. The smaller steps we chose, the
smaller quantizing error we will get. However, smaller steps means splitting
the amplitude range into more values, and that will require more bits and more
memory to represent. So mimizing the quantizing error does come at a cost. Note
that the quantizing error only has to do with the accuracy of the signal
amplitude but not the signal frequency.
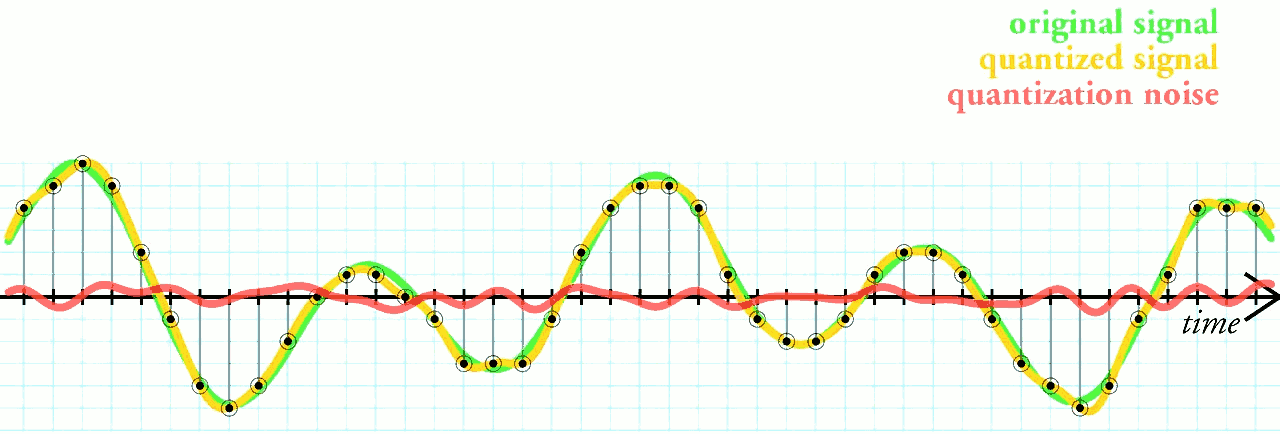 Sampling and quantizing with quantization error (noise). Image from Wikimedia.
Finally, each quantized amplitude value is digitally encoded with a number
of bits. In our example every encoding would be encoded with 24 bits.
So now we have discussed the two parameters that control the above process, and
which we can control; the sampling frequency \(f_s\) and the number of bits
\(b\) to use for the quantized amplitude values. We call the later value the
bit depth, and in our example above, we chose a sampling frequency \(f_s\)
of 44.1 kHz and a bit depth \(b\) of 24-Bits. Now we can visualize the entire
process with analog-to-digital conversion in our stylized recorder.
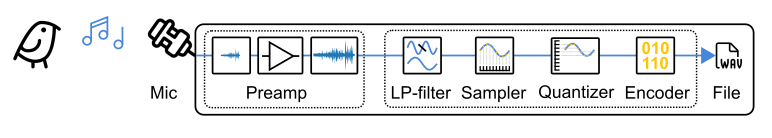 The analog to digital conversion process with sampling, quantizing and encoding.
All cheaper and simpler digital recording equipment will have preset values for
sampling frequency and bit depth. But better recording equipment, such as most
handheld recorders, will allow you to set these parameters, to one of a standard
set of parameter values. 44.1 kHz sampling frequency and 24-bit bit depth are
such standard values, and they are also very suitable for recording birds.
Ok, so how do we chose a good sampling frequency and why did we choose 44,1 kHz
in the example above? Enter the truly amazing Nyquist-Shannon sampling theorem.
It is also the explanation for the box labelled LP-filter in the above picture.
The amazing Nyquist-Shannon
Harry Nyquist was a Swedish electronic engineer who
made important contributions to the mathematical disciplines of communication
theory and information theory. Claude E. Shannon was an American mathematician
and electronic engineer who in 1948 wrote the seminal paper "A Mathematical
Theory of Communication" that in effect defined the new discipline of Information
Theory. Information Theory is the mathematical foundation for all digital
technology and communication. I've always been intrigued by the fact that, when
Shannon's paper was reprinted as a book one year later, its title was changed to
"The Mathematical Theory of Communication". We stand on the shoulders of giants.
theorem in signal processing
and communication theory
simply says:
If a function \(x(t)\) contains no frequencies higher than \(f_{max}\) hertz, it is completely determined by giving its values at a series of points spaced \(\frac{1}{2*f_{max}}\) seconds apart.
Ok, I promised no mathematics, but this is important. What does this theorem
mean in practice?
It means that if we sample an analog signal, where the highest frequency
component of the analog signal is \(f_{max}\) Hz, with a sampling frequency
\(f_s\) that is at least twice as large as \(f_{max}\) we will have
all the information neccessary to perfectly recreate the analog signal, from
the sampled signal, at a later time.
Think about it. You, have to agree, that is amazing! And, of course, it can be
mathematically proven.
It means we can record an analog signal, sample it and convert it to a digital
signal without any loss of frequency information, and then analyze the frequency
contents of the original signal as well as convert the digital signal back to an
analog signal that can be played through a loudspeaker.
What happens then if we sample the analog signal with a sampling frequency of
less than twice as large as \(f_{max}\)? Well, ugly things happens. The higher
frequencies will be captured but they will result in an incorrect representation
of the actual frequency. When we try to recreate the analog signal from these
sampling points, we will have lost the information of the the original higher
frequency components they represented, and they will be interpreted as lower
frequency components and affect the resulting digital representation and sound
of the recording. This phenomenon is called aliasing and is something we want
to avoid when sampling.
So, what can we do to avoid aliasing? Well, we can ensure that the analog
signal we want to sample has no higher frequencies \(f_{max}\) than \(0.5 * f_s\). This is
done by first letting the analog signal go through an analog low-pass filter
that removes all frequency components above \(0.5 * f_s\).
That means when we set our sampling frequency in the recorder to 44,1 Khz, it
will configure an internal low-pass filter to only let frequency components in
the signal that are under 22,05 kHz, pass through. Remember very few bird
vocalisations go over 12 kHz, so choosing a sampling rate of 44,1 kHz, with a
low-pass filter of 22,05 kHz, will allow us to sample all bird songs and calls
with perfect fidelity as far as frequency components are considered. However,
remember that quantizing introduces a quantizing error, which does mean that
perfect audio reproduction of the original analog signal will not be possible.
The complete analog to digital conversion process.
Calculating the size of a digital recording
We can now calculate the size \(s_B\) in Bytes of a digital recording, based
on the selected sampling freqeuncy \(f_s\), the bit depth \(b\) in Bytes
and the length of the recording \(t_r\). This is relevant when we want to
estimate how much storage space we will need for our recordings. We define
a Byte as 8 bits
A Byte is a unit of digital information that most commonly consists of eight
bits. It has historically been used to denote sequences of bits, of various sizes,
which make sense in a particular computing environment and hardware. There is
no formal standard for how many bits a Byte represents. However today, in the
context of consumer computers and the Internet, a Byte is 8 bits.
so a 24 bit depth is equivalent to 3 Bytes per sample.
The general formula is:
\[s_B = f_s * b * t_r\]
When we deal with larger number of Bytes we usually express the data size in
KBytes (\(1,024\) Bytes), MBytes (\(1,024^2\) Bytes) or GBytes (\(1,024^3\)
Bytes).
The formula above is for a single channel recording. Stereo means recording with
two separate microphones or sensors and results in two separate signals, or
channels. Most recorders allow you to record stereo, which means two channels; a
left channel and a right channel. WAV-files, as well as all other modern audio
file formats, have support for multiple audio channels and stereo, in the same
file. But a stereo recording with two channels means the recording size will be
double that of a one channel recording.
In real digital sound files, like WAV-files, there is also some additional
information in the file, so there is typically a KByte or two more of data in
the file, but that is negligible with respect to the data size of all the
samples in the recorded channels.
Example 1: 30 second recordings at 44,1 kHz with 24 bit depth
This is typically something we could be doing in the field when we want to
record a bird. Just to make it as concrete as possible, let’s say you do 100
30-second recordings during a one day field trip. We have:
\[f_s = 44,1 \ kHz\]
\[b = 24 \ bits = 3 \ Bytes \]
\[t_r = 30 \ seconds\]
That means we get this size for a single 30 second recording (one channel):
\[s_B = 44,100 * 3 * 30 = 3,969,000 \ Bytes \approx 3,79 \ MBytes\]
In stereo that would be double that, ie. \(\approx 7,58 \ Mbytes\).
And the total size of 100 such recordings in stereo would be:
\[100 * s_B * 2 = 100 * 3,969,000 \ Bytes * 2 = 793,800,000 \ Bytes \approx 757,0 \ MBytes\]
Example 2: An 8 hour recording at 44.1 kHz with 24 bit depth
This is typically something you would do if you are recording nocturnal
migration or if you are observing diurnal migration at a specific place and want
to record everything passing by. We have:
\[f_s = 44,1 \ kHz\]
\[b = 24 \ bits = 3 \ Bytes\]
\[t_r = 8 \ hours* 60 \ minutes * 60 \ seconds = 28,800 \ s\]
That means we get this size for a single 8 hour stereo recording:
\[s_B = 44,100 * 3 * 28,800 * 2 = 7,620,480,000 \ Bytes \approx 7,09 \ GBytes\]
A summary
You should now have a reasonably good picture of the general process of how
digital sound recording of bird songs and calls works.
- Frequencies of Bird song and calls are usually well within the hearing range
of humans and very seldome go over 12 kHz.
- A good microphone and a recorder with a good preamp will produce a good and
clean analog signal with suitable strength and low noise, which can then be
converted to a digital signal.
- Make sure to set the recording level to as high as possible but leave some
space at the top to avoid the signal hitting the ceiling and causing
distortion. The peaks of the strongest sounds should be between -6 dB and
-12 dB. Depending upon the recording situation you could go up to -3 dB.
- Setting the sampling frequency of the recording device to at least 24 kHz
will capture all frequency components of bird vocalisations up to 12 kHz,
but 44,1 kHz is a standard setting availabe in all recorders, so why not just
use that! That will have you covered up to frequencies of 22,05 kHz.
- The higher the quantizing bit depth we choose the less quantizing error we
will get in the digital signal, so make it as high as your memory card allows.
In most recorders you can set it to 24 bits. Remember that the higher
bit depth you chose, the more bits will be used and the larger the audio
files will become. I’m not sure that we can hear much difference between a 16
bit and a 24 bit recording. I’ll be doing some more experiments with that.
But, what the heck, if I can record in 24 bit instead of 16 bit and memory
storage is not an issue, I’ll do that!
- Set the file format used in your recorder to an uncompressed lossless file
format like WAV.
- All recorders have built-in memory storage and also allow you to use a micro
SD-card as well. An internal or SD-card storage of 8 GBytes will give you
approximately 8 hours of recording at 44,1 kHz with 24-bit depth.
The recorder I use is a Sony PCM A-10 recorder,
which fulfills all the requirements above at a decent cost. It has a good preamp
and built in storage capacity of 16 GB which enables me to record up to nearly
16 hours of 24-bit sound at 44,1 kHz.
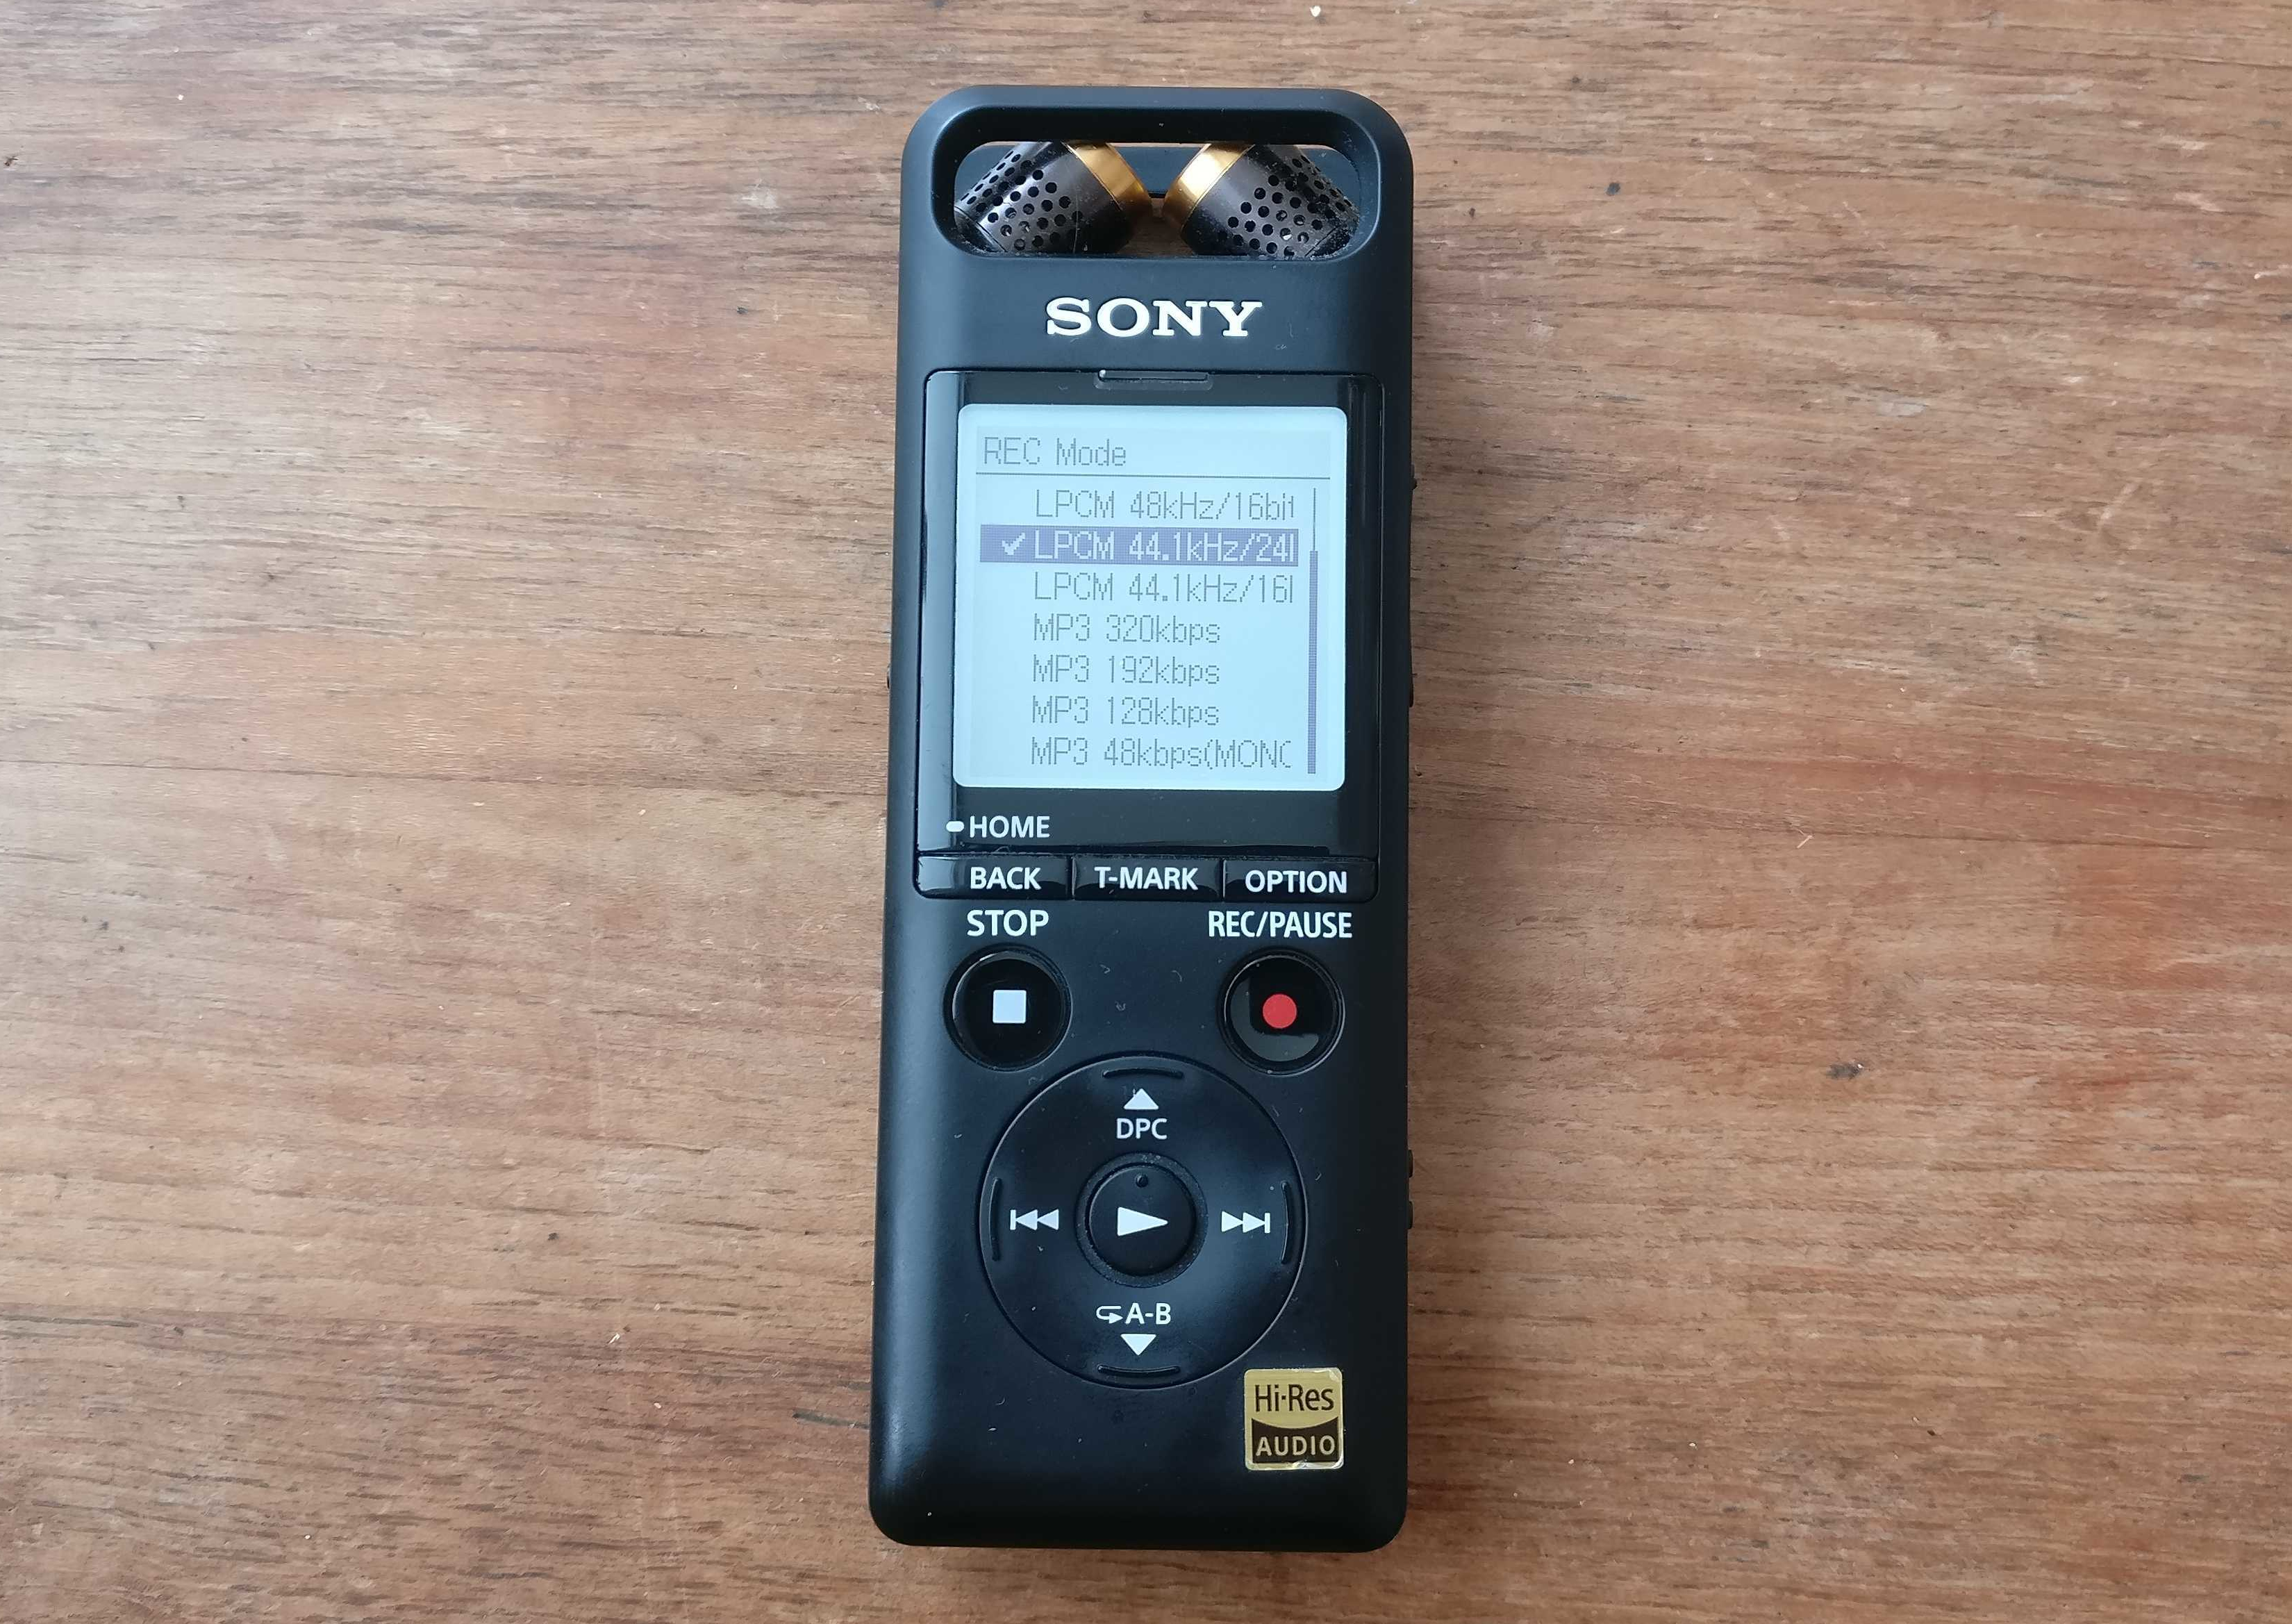 My Sony PCM A10 recorder.
As for editing recorded sounds, creating sonograms and interpreting sonograms,
I’ll cover that in coming articles.
References
- Web arcticle: Wikipedia article on bird vocalization.
Read beteween january and march 2021.
- Scientific article: High-frequency vocalizations in Andean hummingbirds
by F. G.Duque, C. A.Rodríguez-Saltos and W. Wilczynski.
Published in Current Biology, volume 28, issue 17, 10 September 2018.
- Scientific article: High-frequency hearing in a hummingbird
by F. G. Duque, C. A. Rodriguez-Saltos, S. Uma, I. Nasir,
M. F. Monteros, W. Wilczynski and L. L. Carruth. Published in
Science Advances Vol. 6, no. 29, 17 July 2020.
- Book: Digital Communications
by Simon Haykin, 1988. Published by John Wiley & Sons, ISBN 0-471-62947-2.
Out of print, but still a good book on digital communications. I originally
read this when studying for my computer engineering degree at the Faculty of
Engineering at Lund University.
- Web article: Wikipedia article on Pulse-code modulation
Read beteween january and march 2021.
- Web article: Wikipedia article on Nyquist-Shannon sampling theorem
Read between january and march 2021.
- Web article: Wikipedia article on The Mathematical Theory of Communication.
Read between january and march 2021.
- Scientific article: A Mathematical Theory of Communication
by Claude E. Shannon- Published in the Bell System Technical Journal,
Vol. 27, July, October, 1948.
- Web article: Wikipedia article on Quantization (signal processing)
Read between january and march 2021.